Trace Viewer
Screenshots and diagrams on this page illustrate the historical desktop tools or conversion workflow; installed versions may look different.
The new TraceViewer form is part of the new diagnostics functionality in the PPJ Framework. When using our FormViewerTraceListener, all traces are immediately sent to our TraceViewer form. The viewer runs on a separate thread, but trace creation, delivery, storage, and rendering still consume resources.
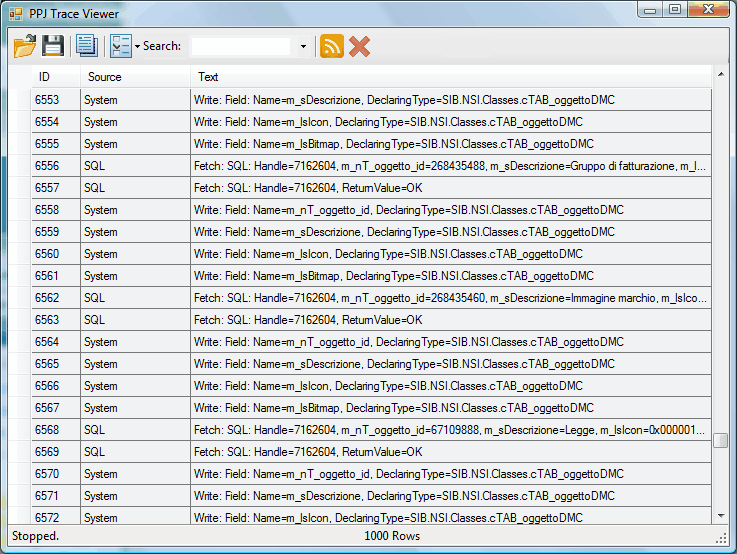
The viewer is quite simple. It shows all traces coming in. Using the viewer you can search the traces, save them to a file or reload a saved file. You can also filter the traces by enabling or disabling the sources.
Load a trace file
Loads a file saved by the trace viewer or by the TextWriterListener. Use the file formats supported by the installed viewer.
Save a trace file
Saves the trace rows to a text file.
Copy rows
Copies the selected rows to the clipboard.
Filter sources
Enables or disables receiving traces for the selected sources. Note that if a source is not enabled in the app.exe.config file or programmatically, the trace calls will not reach the listener and cannot be displayed in the trace viewer even if the source is enabled here.

Search
Selects the next row that contains the typed text.
Start/Stop
Disables or enables receiving traces from the application.
Clear
Deletes all the trace rows.
Diagnostic Workflow
The viewer is intended for interactive desktop diagnostics. A source disabled at its trace switch cannot be recovered by enabling a viewer filter later. Capture only the needed interval and save the result before clearing it. Use an appropriate server-side listener for a web-hosted application.